Digital channels and usage continue to grow. Consumers use multiple online channels when researching and purchasing and often traverse between devices when they do so. Marketers are inundated by more types of digital data and are continually adjusting their strategies to ingest more data and to improve their marketing execution.
While we know digital marketing is constantly evolving, here are some of the top stats you should be aware.
Email Marketing Statistics

- Email is the most effective digital channel. Email marketing has a median ROI of 122%, more than four times higher than any other digital marketing format. Email is nearly 40 times more effective than social channels in helping brands acquire new customers. (eMarketer)
- 99% of email users check their email every day, some as much as 20 times a day. Of those people, 58% of consumers check their email first thing in the morning. (OptinMonster)
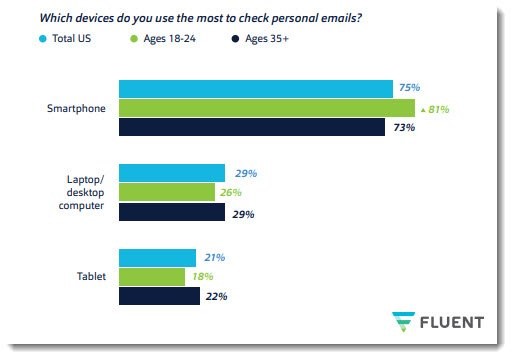
- About 3 in 5 consumers check their email on the go and 75% of Americans say they use their smartphones most often to check email. (Fluent)
- Triggered emails, which are messages delivered only when an individual has taken a certain action such as subscribing or abandoning a shopping cart, have a 71% higher average open rate and 102% higher average click-through rate compared to general newsletters. (Benchmark Email) Marketers should experiment with adding more types of triggered emails to their marketing mix.
- Customer testimonials and making subscribers aware of new products or services tie for the second-most effective re-targeting campaigns, with 37% reporting using them effectively. Coupons/discounts and surveys are also considered by more to be effective than ineffective, though the gap is narrower for surveys than for other types.
- Your audience will reward you with higher open and click rates if you don’t send more than five newsletters a week. (GetResponse, 2020)
- 60% of retail, e-commerce, and consumer goods and services companies are personalizing emails based on past purchases, versus 38% in 2019. (Litmus, 2020)
- More than 8 out of 10 people will open a welcome email, generating 4x as many opens and 10x as many clicks as other email types. (GetResponse, 2020)
- The single message autoresponder email had an astonishing 98% open rate and a 37% click-through rate. (GetResponse, 2020)
- Nearly 22% of all email campaigns are opened within the first hour of sending. (GetResponse, 2020)
- 59% of Millennials primarily use their smartphone to check email, while 67% of Generation Z scans their inbox on mobile. (Bluecore, 2021)
- 74% of Baby Boomers think email is the most personal channel to receive communications from brands, followed by 72% of Gen X, 64% of Millennials, and 60% of Gen Z. (Bluecore, 2021)
Social Marketing Statistics

- The latest social media statistics show that there are 3.78 billion social media users worldwide in 2021. (Statista, 2021)
- In the US, at least 79% of internet users are on social media. The total number of social media users will likely reach 257 million by the end of 2023. (Statista, 2021)
- The top social media networks ranked by the number of active users are Facebook, YouTube, WhatsApp and Facebook Messenger. (Statista, 2021)

- Internet users spend an average of 144 minutes on social media per day. (Statista, 2021)
- n a 2021 HubSpot Blog poll of 1,000+ global marketing professionals, 79% of marketers report buying paid advertising on social media. (HubSpot, 2021)
- According the same poll, 85% of marketers rank short-form videos as the most effective type of social media content in 2021 (HubSpot, 2021)
- 54% of social browsers use social media to research products. (GlobalWebIndex)
- According to Emarketer, social media has a wide range of saturation based on age. Millennials lead the way with 90.4% being active users. For Gen X, that number is 77.5%, and Baby Boomers still participate at a rate of 48.2%. (Oberlo, 2021)
- Non-customers are three times more likely than customers to visit retailers from social media ads.
- 50% of consumers said that seeing user-generated content would increase their chances of buying products through a brand’s social media. (Curalate)
- 73% of consumers want to see posts about discounts and sales. 60% want to see posts that showcase new products and services. 59% want to see posts that teach something. (Sprout Social)
- The most common reason why consumers reach out to brands on social media is because they have a question. 57% of consumers reported doing this. The second most common reason is to have an issue with a product or service resolved. 45% of consumers have done this. (Sprout Social) Brands must be constantly monitoring social channels to engage with consumers in a timely manner, build relationships and provide better experiences.
Digital Marketing Statistics to Know

- 32% of marketers still find it difficult to measure ROI on digital marketing campaigns. (Criteo, 2021)
- Greater digitalization of business processes and scaling online presence have become marketers’ top priorities in anticipation of future Covid-19-type situations. (Criteo, 2021)
- One in three marketers say the pandemic has resulted in rapid digital transformation of business processes (Criteo, 2021)
- 45% of organizations don’t have a clearly defined digital marketing strategy. (Smart Insights, 2020)
- The average daily time spent with digital media is now almost 8 hours. This is a seven-minute increase from 2020. This is also in contrast to traditional advertising (TV, radio, newspapers, and magazines), which is 5.5 hours and decreasing. (Wordstream, 2021)
Mobile Marketing Statistics

- The vast majority of time spent on the internet is through mobile apps. In 2022, the daily time spent on mobile apps is projected to reach 227 minutes per day, up from 215 minutes in 2020. (SEMRush, 2021)
- In 2020, the U.S. was the leading largest mobile advertising spending market globally, resulting in $120.4 billion. (SEMRush, 2021)
- By 2024, it’s predicted that the U.S. mobile advertising spending market will reach $145.26 billion. (SEMRush, 2021)
- 60% of online retail website visits come from mobile devices.(Adobe, 2021)
- With over $190 billion spent on smartphone devices in 2020, mobile accounts for 40% of all online sales, and this number will surpass 50% by 2022. (Adobe, 2021)
- 27% of marketers in the U.S. and U.K. thought playable mobile ads had the highest retention rates. (Statista, 2021)
- 40% of U.S media buying decision-makers are very confident that their organization was able to measure the conversion rates of their mobile advertising efforts.(Statista, 2021)
- Appearing in mobile search ad results can increase brand awareness by 46 percent. (Think with Google)
- Mobile ad campaigns are five times more effective than online advertisements. (Mobile Marketer)
- 40% of all mobile users are searching for a local business or interest. (Impact)
- 57% of all mobile users will not recommend a business if their mobile website is poorly designed or unresponsive.
- Mobile websites that load in 5 seconds or less will end in a viewing session that’s 70% longer than their slower counterparts.
- A mobile special or offer is 10 times more likely to be used than the same offer in print form. (Omnicore)
- After seeing a marketing email, half of consumers (50%) have purchased through mobile websites, 24% through a smartphone app, 35% purchased on a computer, 27% in-store. (Fluent)
- 52% of consumers are put off with a business after a bad mobile experience and 40% will go to your competitor instead, after a bad experience with your mobile site. (LinkedIn)
- A slow page can result in a 97% mobile shopping cart abandonment. (LinkedIn)
- 80% of buyers used their mobiles inside a store for product reviews, price comparison and alternative options and other store locations. (LinkedIn)
- Mobile-influenced offline spending was more than $1 Trillion. (Biznessapps)
- 48% of the buyers use smartphones as the first point of contact to start their search. (Thinkwithgoogle)
Simply for Fun

- The original name of Twitter was actually Twttr. A few months before Twitter launched, the founders decided to change the name and rebrand. (bitrebels.com)
- Google’s first ever tweet was sent in 2009. It was binary code for “I’m Feeling Lucky”, which is the button next to the search button on Google. (OMGFacts)
- China has treatment camps for internet addicts. 200 million Internet users in China are between the ages of 15 and 35.
- The first webcam was created at the University of Cambridge to monitor the Trojan coffee pot. A live 128×128 grayscale picture of the state of the coffee pot was provided as the video feed.
- The internet is 11,979 days old. You can check the latest update on HowOldIsTheInter.net.