1. Over 90% of car buyers conducted extensive online research before visiting a dealership. (Forrester)
2. Over 70% of car shoppers used at least two devices (such as smartphones, tablets, and laptops) throughout their research process. This omnichannel approach highlights the importance of a seamless digital experience across all platforms for automotive brands. (Statista)
3. Most car buyers are undecided at the start of the shopping process. When they first begin to shop, 6 out of 10 of them are open to considering multiple vehicle options. (Autotrader)
4. Third-party sites are the most used sites for car shopping, used by over 80% of shoppers. (Autotrader)
5. 55-60% of car shoppers begin their journey online, however in-person visits still hold considerable weight. According to a 2024 study by Cox Automotive, approximately 40-45% of car shoppers still make their initial contact with a dealership through a walk-in visit. This highlights the continued importance of a strong physical presence and a welcoming in-store experience for dealerships.
6. The top five activities conducted online by car shoppers include researching car prices (over 80%), finding actual cars listed for sale (75%), comparing different models (over 70%), finding out what current car is worth (65%), and locating a dealer or getting dealer info (55-60%). (Autotrader)
7. When asked to rate their satisfaction on a scale of 1-10, 81% of car buyers gave the test-driving process an 8-10 rating. However, satisfaction declined to 67% when interactions with the F&I department were factored in. Of the 3-hours average time spent at the dealer during the purchase process, more than half of that time is spent negotiating or doing paperwork, resulting in a 56% satisfaction rate for the process. (Autotrader)
8. In 2024, social media significantly influenced car buying decisions. Over 40% of automotive shoppers utilized social media platforms during their vehicle research process, a substantial increase from previous years. Key platforms include YouTube, Instagram, TikTok, and Facebook. (Adtaxi)
9. A 2024 study by J.D. Power found that while a significant number of car shoppers use social media during their research, its impact on the final decision may be more nuanced. It is estimated that around 25-35% of car buyers reported that social media significantly influenced their vehicle purchase decision. This could include factors like.
10. In 2024, a significant portion of new car buyers shared their excitement online, with over 40% posting photos or videos of their new vehicle on social media platforms. Facebook remained the top platform for posting. Instagram saw a substantial increase in car-related posts, also solidifying its position as a key channel for automotive enthusiasts to share their new vehicles with their networks. (J.D. Power))
11. In 2024, mobile devices have become the dominant platform for automotive research. Over 70% of automotive internet shoppers utilize a mobile device (smartphones and tablets) during their car-buying journey. (Google)
12. Millennials, on average, researched and considered approximately 18-20 different vehicle models before making a purchase decision, while Baby Boomers typically considered around 15-17 models. Millennials also invested more time in the decision-making process, taking an average of 18-20 weeks to finalize their vehicle selection, compared to 16-18 weeks for Baby Boomers. Millennials generally spent more time on the overall car-buying process, investing approximately 5-7 more hours on average than Baby Boomers. (J.D. Power)
13. Over 70% of Americans reported disliking at least one aspect of the car buying process at a dealership in 2024. (J.D. Power) More than half of Americans (55-60%) feel they’ve been taken advantage of at some point during a car dealership visit. (CarGurus)
14. Over 40% of car buyers experience some level of anxiety or stress during the vehicle purchasing process. This sentiment is particularly pronounced among younger generations. Millennials and Gen Z, who are more digitally-savvy and accustomed to transparent online experiences, often find the traditional dealership environment intimidating and overwhelming. (Cox Automotive)
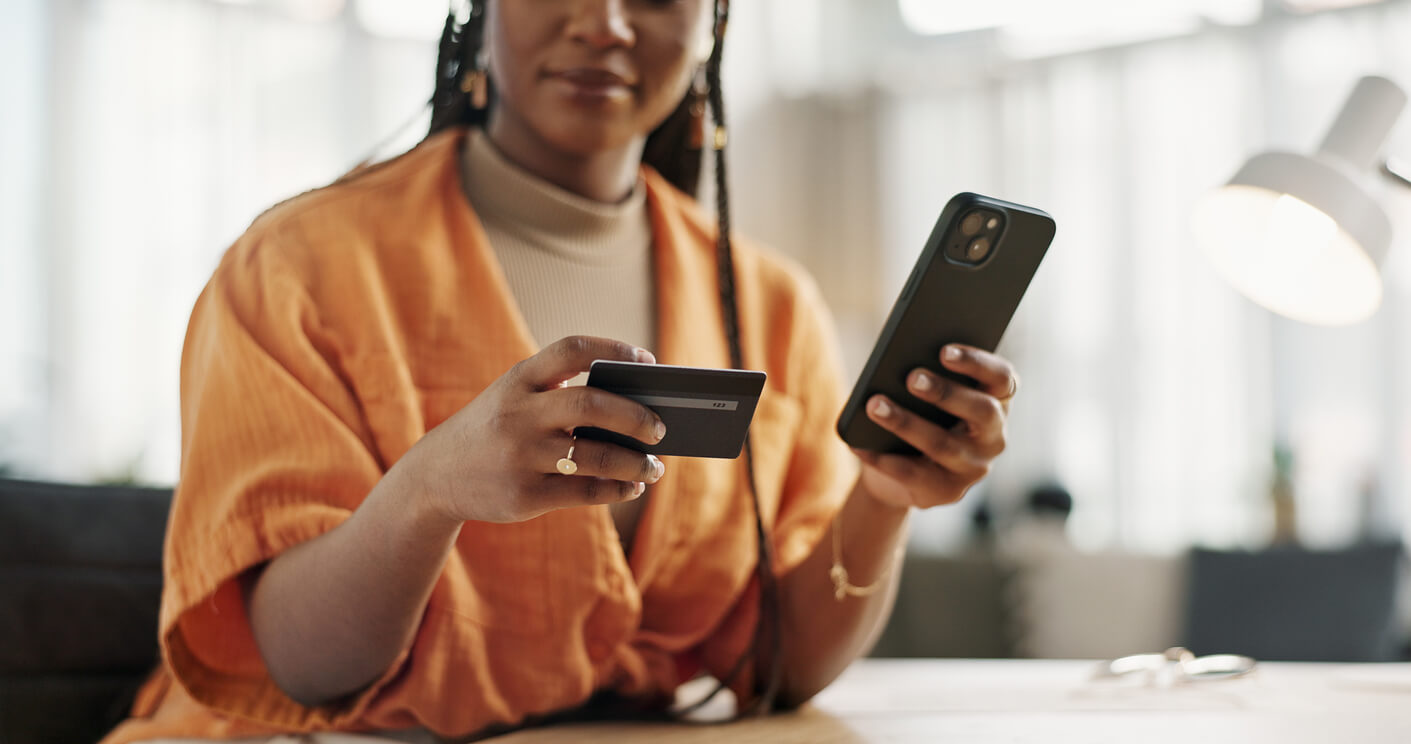
15. In 2024, a significant shift occurred in car buying behavior, with a strong emphasis on digital channels. According to a recent study by Cox Automotive, over 60% of car buyers expressed a strong preference for online car buying experiences, including features like online vehicle configuration, at-home test drives, and digital financing options. Nearly 45% of car buyers surveyed indicated they would be comfortable purchasing a vehicle entirely online without a physical inspection, provided they had access to comprehensive vehicle information, high-quality images and videos, and a robust return policy.
16. Over 70% of car buyers now primarily use their smartphones to research vehicles, compare models, read reviews, and even schedule test drives. More than 50% of car buyers prefer to consult friends and family about their car purchase options through their mobile devices. Around 40% of car buyers prefer to book test drives directly from their smartphones. (Statista, eMarketer)
17. For automotive dealers, the biggest marketing priority by far is increasing lead volume and conversions. (Autotrader)
18. Dealerships are also utilizing the data they have on hand prior to contacting a prospect. The most common pieces of consumer data include basic contact details, online behavior, vehicle interest, communication preference, and purchase/service history. (Autotrader)
19. According to J.D. Power, 60-70% of consumers indicated they would be willing to choose a dealership that offered their preferred experience, even if it meant paying a slightly higher price. This shift in consumer priorities underscores the growing importance of customer service and personalization.
20. A 2024 study by Cox Automotive found that over 75% of consumers would visit dealerships more often if the car buying process were improved.
21. Research that Google commissioned from Millward Brown Digital indicates that 80% of people who used YouTube as part of their car buying process were influenced by what they watched and views on YouTube of test drives, features and options, and walk-throughs have surged in recent years.
22. A report by automotive research company, SBD provides evidence that these connected systems are important to younger, more digitally oriented consumers and will likely impact their next vehicle brand purchase decision. Cars play a key role in supporting Millennials’ need to stay connected, and in a study by Autotrader.com, 72% of younger millennials indicated that a car is important to their social life. Style and features, especially technology, are critically important to them. For example, more than 70% of younger millennials cite technology and infotainment features as “must-haves” when purchasing a car.
23. Integrated mobile apps and connected vehicle services deliver more value for the customer, enhancing customer loyalty after the initial car purchase. A study by DMEautomotive showed that vehicle buyers using a branded app were 73% more likely to make a purchase from the dealership, and after making a purchase, booked 25% more service appointments than shoppers without an app.
24. They also spent more money than non-app users when purchasing a vehicle, 7% more according to a study commissioned by Cars.com.
25. In 2024, industry benchmarks revealed significant improvements in customer response times across the automotive sector. Studies by J.D. Power and other industry sources indicated that many dealerships now respond to customer inquiries within 2-4 hours, a substantial improvement over previous years. While OEMs also made strides, their average response times typically ranged between 6-12 hours.


