New movers are a lucrative audience, in-market to purchase a variety of goods and services. The New Mover Trends Report unveiled several profound insights on millennial new movers.
Now, with the influx of millennials entering the homebuying market, our data showcases when millennial new movers are making purchases, how much they’re spending, what’s enticing them to try new brands and more.
12 Millennial New Mover Shopping Behavior Statistics
Check out the latest millennial new mover statistics to better understand this generation’s spending habits throughout the moving journey and how it compares to the total population of new movers.
1. When asked, “How many months before your most recent move did you start researching each of the following: mortgage, home insurance, home inspection, moving services?”


Millennial vs Total: Whether or Not Research was Conducted for Services


2. When asked, “Which of the following items did you/do you anticipate you will purchase within the first 12 months of moving?”
- 47% said furniture/home décor
- 50% said TV
- 46% said appliances
- 39% said home improvement repair and supplies
- 31% said pet supplies
- 35% said flooring
- 34% said landscaping/lawn equipment
- 29% said automobile repair/maintenance
- 30% said windows
- 28% said fitness products or gym membership
- 22% said solar
- 4% said none
Millennial vs Total: Anticipated Items to Purchase in the First 12 Months

3. When asked, “What services did you/do you anticipate finding a provider for within the first 12 months of moving?”
- 51% said internet
- 41% said utilities
- 35% said home security
- 29% said doctor/dentist
- 30% said home remodeling/repair services
- 26% said financial services/banking
- 28% said landscaping/lawncare maintenance
- 25% said flooring installation
- 27% said home warranty
- 26% said solar installation
- 25% said windows installation
- 20% said roof installation
- 15% said veterinarian
- 9% said none
Millennial vs Total: Anticipated Services to Find a Provider for Within the First 12 Months of Moving

4. When asked, “How much money do you estimate you spent/will spend on the following items that you purchased/will purchase within the first 12 months of moving in total?”
Millennial new movers said they spent/plan to spend an average of…
- $10, 329 on automobile
- $1,946 on furniture/home décor
- $1,593 on solar panels
- $1,177 on home improvement repair and supplies
- $1,429 on windows
- $1,605 on flooring
- $1,149 on appliances
- $956 on landscaping and lawn equipment
- $573 on TV
- $490 on automobile repair/maintenance
- $341 on fitness products or gym membership
- $291 on pet supplies (e.g., bedding, food)
Millennial vs Total: Average Estimated Amount Spent on Items

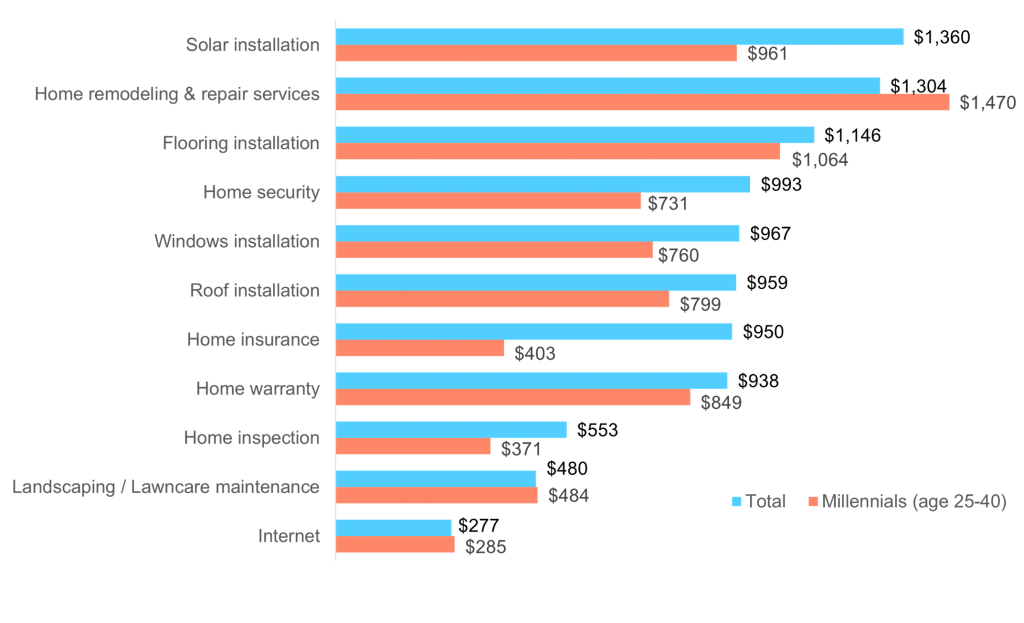
5. When asked, “How much money do you estimate you spent/will spend on each of the following type(s) of services you found/will find a provider for within the first 12 months of moving in total?”
Millennial new movers said they spent/plan to spend an average of…
- $961 on solar installation
- $1,470 on home remodeling & repair services
- $1,064 on flooring installation
- $731 on home security
- $760 on windows installation
- $799 on roof installation
- $403 on home insurance
- $849 on home warranty
- $371 on home inspection
- $484 on landscaping/lawncare maintenance
- $245 on internet
Millennial vs Total: Average Estimated Amount Spent on Services
6. When asked, “For each of the following type(s) of items you purchased within the first 12 months of moving, when did you actually purchase each type of item?”

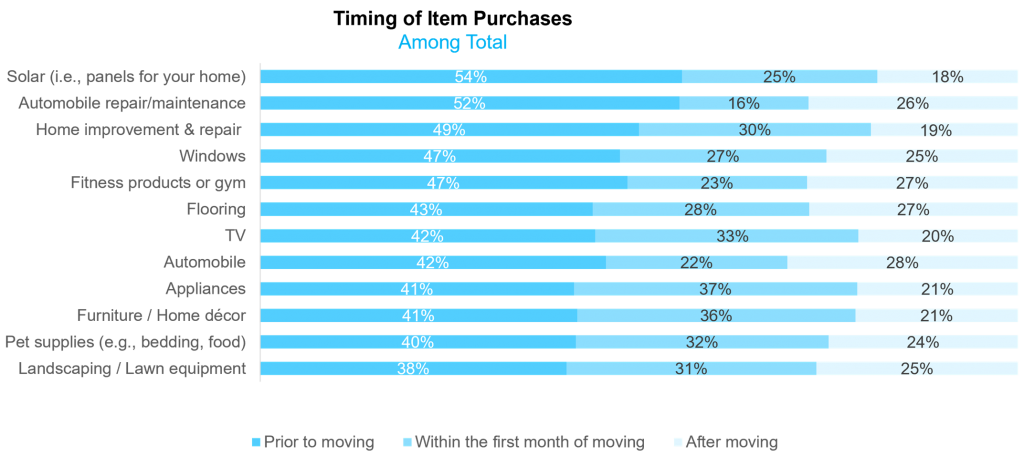
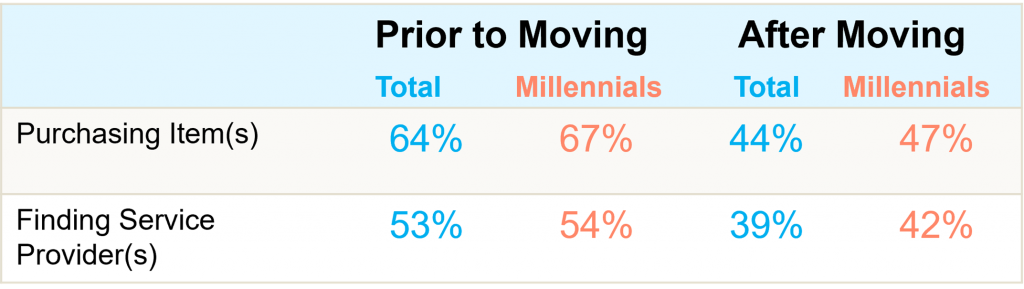
7. When asked, “For each of the following type(s) of services you found a provider for within the first 12 months of moving, when did you actually change providers for each type of service?”
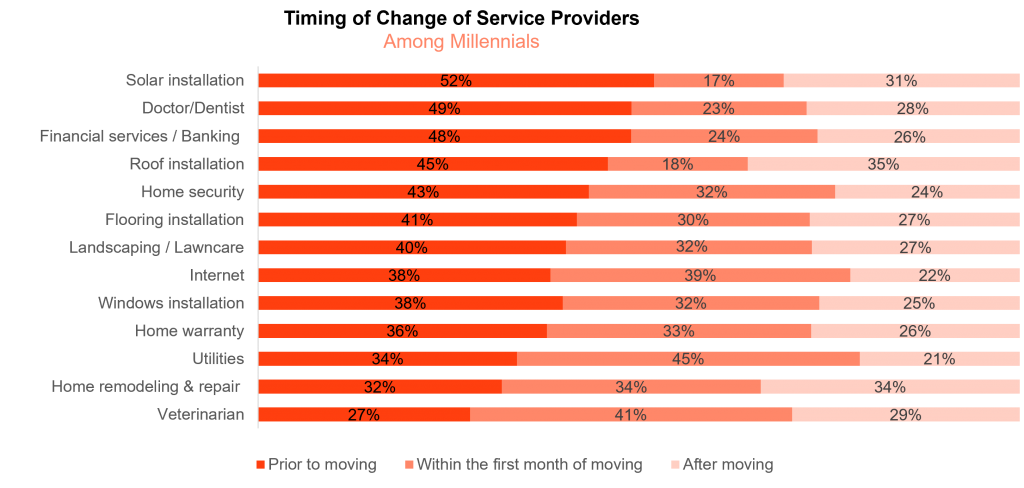
Millennial vs. Total: Timing of Item Purchases/Finding Service Providers
8. When asked, “Which of the following home improvement projects are you doing/planning to do or have already done in your new home? Please select all that apply.”
- 41% said painting
- 37% said redecorating
- 39% said kitchen remodeling
- 34% said landscaping
- 37% said bathroom modeling
- 32% said update flooring
- 32% said adding a deck/patio
- 30% said expanding a living space
- 28% said installing a pool/hot tub
Millennial vs. Total: Home Improvement Projects Planned


9. When asked, “Which of the following methods do you use to research the type(s) of businesses/items you may purchase from/purchase? Please select all that apply.”
- 46% said online research
- 43% said online customer reviews
- 33% said recommendations from family, friends, and neighbors
- 31% said visit the store to ask about certain items
- 32% said online ads
- 26% said information received by email
- 27% said local forums/groups (e.g., NextDoor, Facebook)
- 24% said information received by mail
Millennials vs Total: Research Methods

10. When asked, “Which of the following would entice you to try a new brand? Please select all that apply.
- 52% said good reviews
- 49% said better prices than other brands of the same industry
- 43% said recommendations from family/friends/neighbors
- 39% said discounts/coupons available
- 37% said “brand contacted me directly with a company advertisement.”
Millennials vs Total: Enticements to Try a New Brand

11. When asked, “Which of the following types of items would you be most likely to try a new brand/company? Please select all that apply.”
- 37% said furniture/home décor
- 33% said TV
- 34% said appliances
- 34% said home improvement & repair supplies (e.g., wood, caulk, paint)
- 26% said pet supplies (e.g., bedding, food)
- 24% said fitness products or gym membership
- 23% said flooring (e.g., carpet, tile, wood)
- 26% said landscaping/lawn equipment (e.g., mower, plants, grass seed)
- 22% said automobile
- 21% said automobile repair/maintenance
- 24% said windows
- 21% said solar panels
- 8% said none
Millennial vs. Total: Items New Movers Most Likely to Try a New/Brand Company From


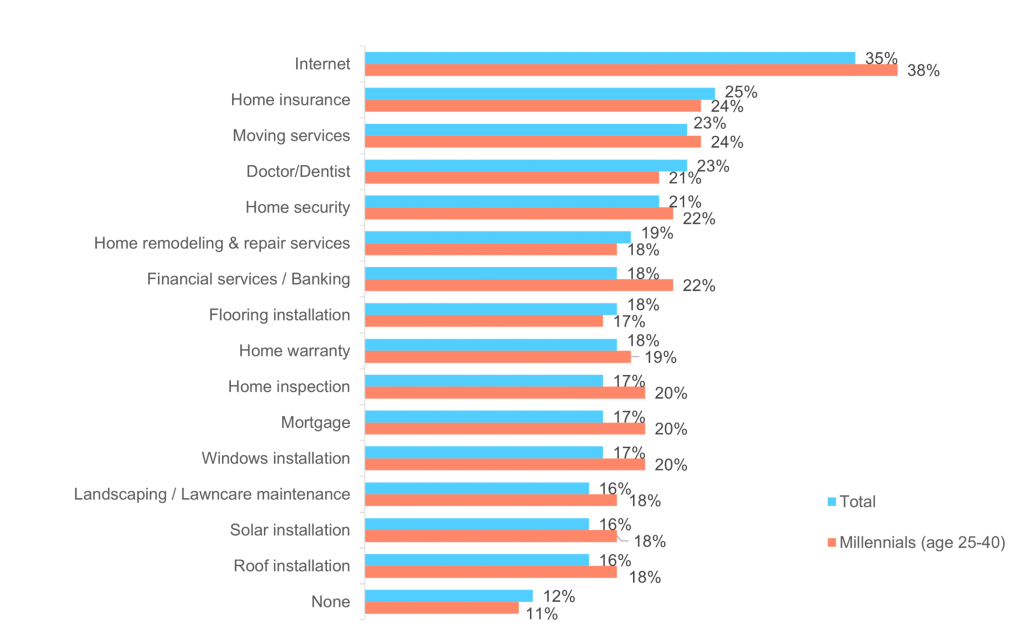
12. When asked, “Which of the following types of services would you be most likely to try a new provider/company? Please select all that apply.
- 38% said internet
- 24% said home insurance
- 24% said moving services
- 21% said doctor/dentist
- 22% said home security
- 18% said home remodeling & repair services
- 22% said financial services/banking
- 17% said flooring installation
- 19% said home warranty
- 20% said home inspection
- 20% said mortgage
- 20% said window installation
- 18% said landscaping/lawncare maintenance
- 18% said solar installation
- 18% said roof installation
- 11% said none
Millennial vs. Total: Services New Movers Most Likely to Try New Brand/Company From