Digital media continues to be the top driver of growth in global advertising, capturing 72 cents of every incremental ad dollar in 2016. This number is projected to grow to 77 cents this year, according to a recent forecast by WPP’s GroupM, the world’s largest ad buyer. Total advertising spend worldwide for 2017 is predicted to be $547 billion, up 4.4% from $524 billion in 2016, according to the report. The biggest drivers for digital ad growth are paid search, ecommerce and ads on mobile devices.
The role of marketing technology is playing an increasingly critical role as marketing data becomes more sophisticated and more pervasive within the advertising ecosystem. Today’s marketers are deploying an average of five technology solutions to buy digital media, according to a recent study jointly conducted by Forrester Consulting and SteelHouse, an advertising software company.
According to the survey, marketers face several challenges in regards to managing digital advertising including:
- Purchasing a variety of ads, frequently. An average of four types of digital media – social ads (89%), display banner ads (77%), mobile banner ads (73%), and video ads (65%) – and most purchase from multiple networks at least weekly.
- Managing multiple vendors. Almost half of marketers are working with an average of three vendors. Oftentimes, management barriers occur because of lack of information-sharing (48%), transparency on media buy pricing (48%), and inability to optimize (42%), among others.
- Technology overload. Marketers use an average of five media/marketing tools, with most already using or expanding their use of tools for: site analytics (84%), marketing performance measurement (82%), content marketing asset management (80%), data management platforms (DMPs) (78%), and marketing attribution (77%).
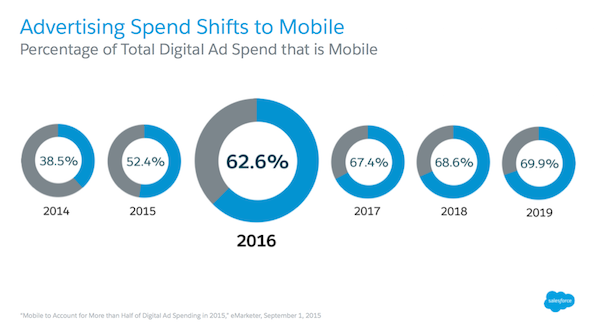
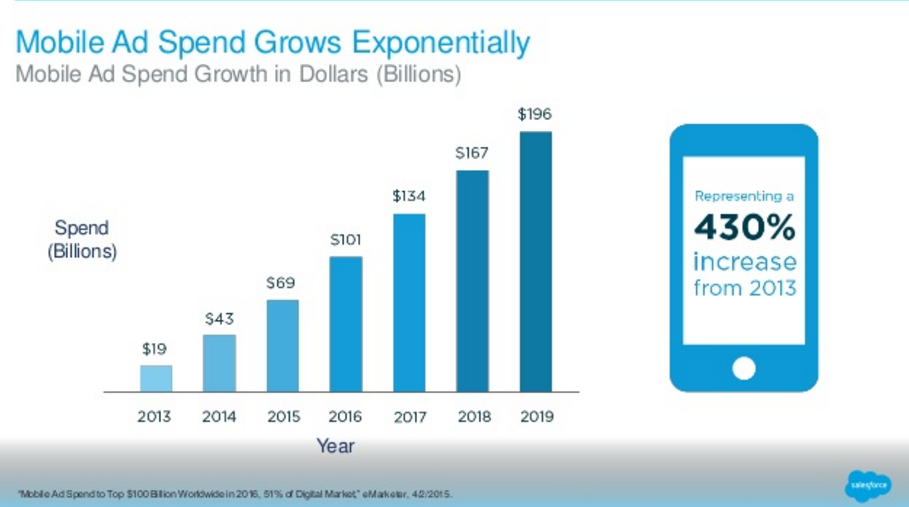
Advertising Spend is Shifting to Mobile
More advertising was spent on mobile than on desktop ads for the first time in 2015. As consumers are increasing the time they spend on mobile devices, this trend will continue to grow. The percentage spend on mobile is forecasted by eMarketer to grow to 70% (or $65B) by 2019.

According to recent data from BI Intelligence, key takeaways on the state of mobile advertising spend include:
- Display and video will be the fastest-growing mobile ad formats as digital ad dollars quickly shift from desktop to mobile, and ad products improve. US mobile display and mobile video ad revenues will grow at an astonishing CAGR of 96% and 73%, respectively, between 2013 and 2018.
- Mobile programmatic ad revenues, including ads sold through real-time bidding (RTB), will account for 43% of US mobile display-related ad revenue in 2018, up from only a 6% share in 2013. But programmatic will still be limited by the lack of robust cookie-based targeting on mobile.
- In-app mobile ads perform much better than mobile web ads, and ad spend will likely follow performance and usage. In-app click-through rates averaged 0.56% globally, compared to 0.23% for mobile web ads during the first half of the year, according to Medialets.

Social Media Advertising is Growing at 20% a Year
Social media advertising is growing at 20 percent a year. By 2019, social ad spend will be worth $50.2 billion compared to $50.7 billion for newspapers according to a study by ad agency Zenith. By 2020, social media will be “comfortably” ahead.
According to the report, “Advertising on platforms like Facebook and Twitter will account for 20 percent of all internet advertising in 2019, up from 16 percent in 2016.”
Check out these other statistics on social media advertising:
- Social media advertising budgets have doubled worldwide over the past 2 years—going from $16 billion U.S. in 2014 to $31 billion in 2016. (Statista)
- In 2017, analysts predicted a 26.3% global increase on spending for social media ads. (eMarketer)
- Twitter advertising revenue totaled $545 million in Q3 of 2016, an increase of 60% year-over-year.
- Mobile advertising revenue accounted for 86% of total Twitter advertising revenue.
- Ad recall from sponsored posts on Instagram was 2.9x higher than Nielsen’s norms for online advertising. (Instagram)
- By the third quarter of 2016, Facebook brought in $6.8 billion in advertising revenue, up from $4.3 billion the year before.
- On Facebook, desktop ads have 8.1x higher click-through rates and mobile ads have 9.1x higher click-through rates than normal web ads.
- Over 70% percent of marketers plan to increase their use of video ads next year. According to a report by Mixpo, Facebook has become the platform of choice for video advertisers.
- 100% of the top 100 global brands have run YouTube ads in the past year. (Pixability)
As digital ad spending continues to grow, marketers must focus on integrating digital marketing strategies with traditional marketing channels. As consumers shop and interact with brands through numerous channels before making a purchase decision, utilizing an omnichannel approach to reach consumers at the right moment is key to optimizing engagement and conversions.
Learn how Porch Group Media can help you get to know your customers better and reach them across channels to boost your marketing success. Contact us to get started!


